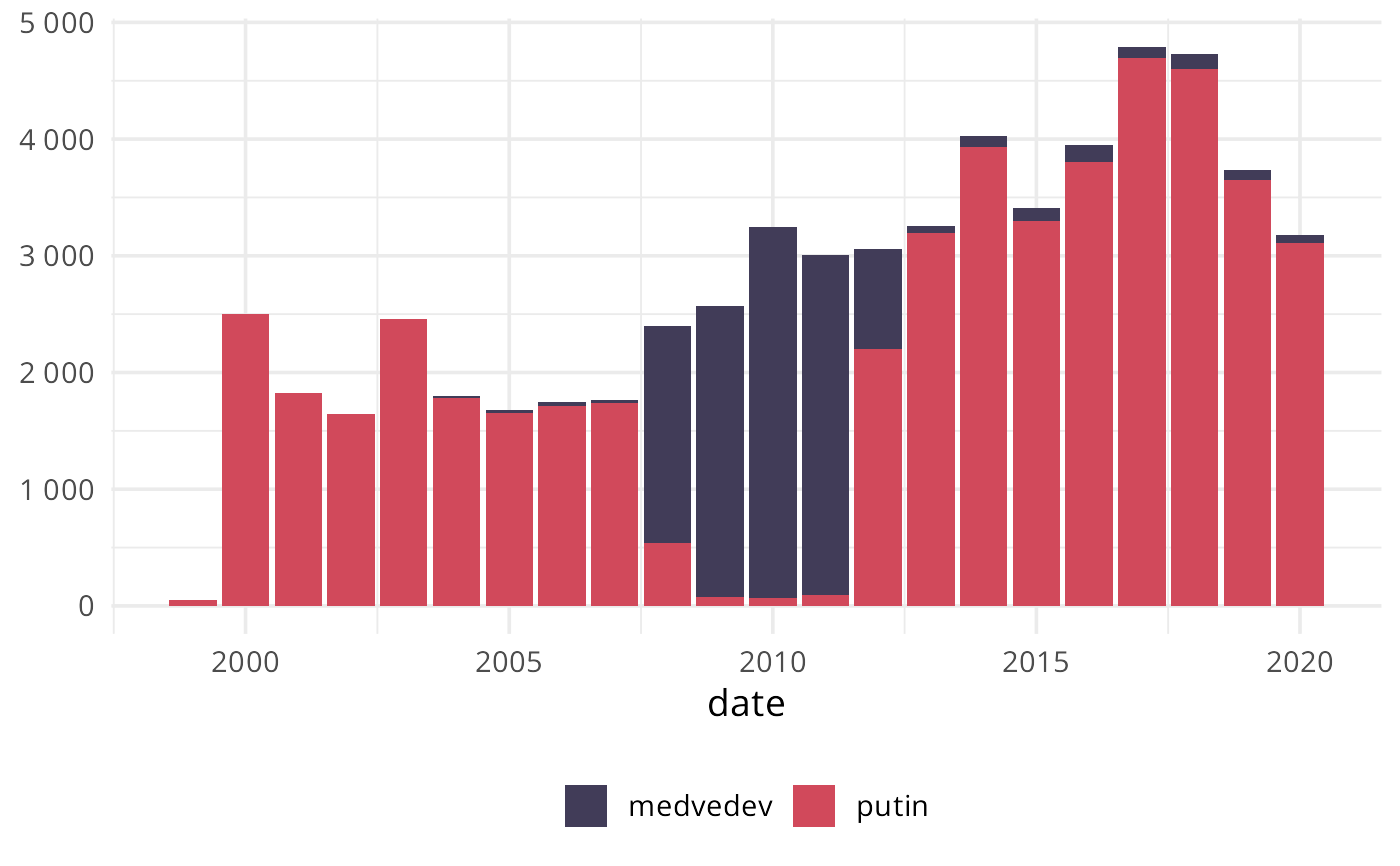
Creates barchart with ggplot2
Arguments
- ggobj
A ggplot2 object, typically generated with
cas_show_gg_base()- position
Defaults to "dodge". Available values include "stack".
Examples
cas_count(
  corpus = castarter::cas_demo_corpus,
  pattern = c("putin", "medvedev")
) |>
  cas_summarise(period = "year") |>
  cas_show_gg_base() |>
  cas_show_barchart_ggplot2(position = "stack")
